G74 Example 1: A bar chart on a Web page showing the sales for the top three salespeople that includes a long description after the chart
October Sales
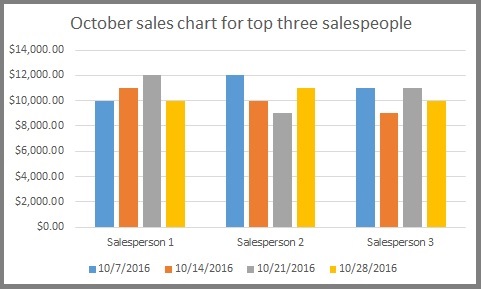
Sales for October show Salesperson 1 is leading with $43,000. Salesperson 2 follows closely with $42,000. Salesperson 3 rounds
out our top 3 with sales of $41,000.